
Public Services and Procurement Canada
Spending and human resources: 2022 to 2023 Departmental Results Report
On this page
Spending from fiscal year 2020 to 2021 until fiscal year 2025 to 2026
The departmental spending trend graph presents trends in the department’s planned and actual spending over time. The data represents actual spending (2020 to 2021 up to 2022 to 2023) and planned spending (2023 to 2024 up to 2025 to 2026) broken down between Statutory and Voted Expenditures.
Analysis of the variances in actual spending and planned spending is provided in the Budgetary performance summary for core responsibilities and internal services section.
Public Services and Procurement Canada's spending (statutory and voted) trend: From fiscal year 2020 to 2021 to fiscal year 2025 to 2026 (in millions of dollars)
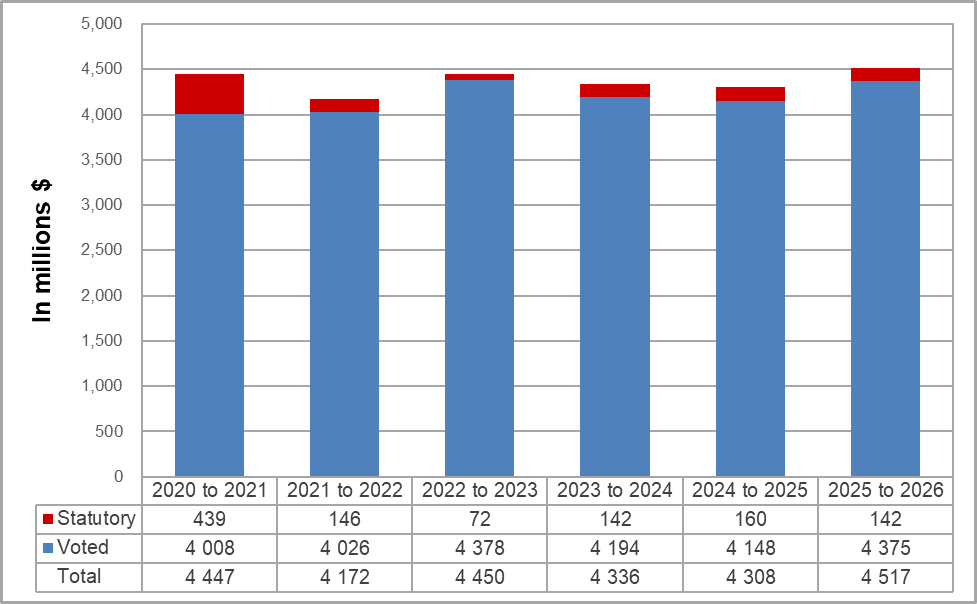
Figure 1: Public Services and Procurement Canada's spending (statutory and voted) trend: From fiscal year 2020 to 2021 to fiscal year 2025 to 2026 (in millions of dollars)—Text version
This bar graph illustrates the planned and actual spending trend for Public Services and Procurement Canada for 6 fiscal years between 2020 to 2021, and 2025 to 2026. Financial figures are presented in millions of dollars along the y-axis (vertical), starting at $0, ending at $5,000 million and increasing by $500 million. These are graphed against fiscal years 2020 to 2021 to 2025 to 2026 on the x-axis (horizontal).
There are 2 items identified for each fiscal year: statutory spending and voted spending.
In 2020 to 2021, actual spending was $439 million for statutory items and $4,008 million for voted items. The total is 4,447 million.
In 2021 to 2022, actual spending was $146 million for statutory items and $4,026 million for voted items. The total is $4,172 million.
In 2022 to 2023, planned spending is $72 million for statutory items and $4,378 million for voted items. The total is $4,450 million.
In 2023 to 2024, planned spending is $142 million for statutory items and $4,194 million for voted items. The total is $4,336 million.
In 2024 to 2025, planned spending is $160 million for statutory items and $4,148 million for voted items. The total is $4,308 million.
In 2025 to 2026, planned spending is $142 million for statutory items and $4,375 million for voted items. The total is $4,517 million.
Budgetary performance summary for core responsibilities and internal services (in dollars)
The “Budgetary performance summary for core responsibilities and internal services” table presents the budgetary financial resources allocated for PSPC’s core responsibilities and for internal services.
| Core responsibilities and internal services | 2022 to 2023 Main Estimates | 2022 to 2023 planned spending | 2023 to 2024 planned spending | 2024 to 2025 planned spending | 2022 to 2023 total authorities available for use | 2020 to 2021 actual spending (authorities used) | 2021 to 2022 actual spending (authorities used) | 2022 to 2023 actual spending (authorities used) |
|---|---|---|---|---|---|---|---|---|
| Purchase of goods and services | 186,574,422 | 186,574,422 | 165,857,889 | 156,827,378 | 342,315,479 | 505,799,452 | 248,612,162 | 184,863,896 |
| Payments and accounting | 537,083,995 | 537,083,995 | 318,700,151 | 318,329,073 | 582,723,741 | 620,095,297 | 584,208,702 | 564,043,558 |
| Property and infrastructure | 3,438,255,690 | 3,438,255,690 | 3,410,522,465 | 3,426,970,107 | 3,370,512,826 | 2,755,014,069 | 2,821,959,418 | 3,197,493,336 |
| Government-wide support | 164,921,320 | 164,921,320 | 156,544,379 | 136,961,762 | 166,873,727 | 181,625,449 | 155,082,347 | 144,364,383 |
| Procurement Ombudsman | 4,198,354 | 4,198,354 | 4,249,776 | 4,249,776 | 4,790,594 | 4,091,748 | 3,995,892 | 4,630,094 |
| Subtotaltable 1 note 1 | 4,331,033,781 | 4,331,033,781 | 4,055,874,660 | 4,043,338,096 | 4,467,216,367 | 4,066,626,015 | 3,813,858,521 | 4,095,395,267 |
| Internal services | 308,579,366 | 308,579,366 | 279,731,031 | 264,490,871 | 409,763,688 | 380,244,932 | 358,493,710 | 354,395,781 |
| Totaltable 1 note 1 | 4,639,613,147 | 4,639,613,147 | 4,335,605,691 | 4,307,828,967 | 4,876,980,055 | 4,446,870,947 | 4,172,352,231 | 4,449,791,048 |
Table 1 Note
|
||||||||
As part of the present Departmental Results Report, PSPC is informing parliamentarians and Canadians of the budgetary performance achieved for 2022 to 2023. This performance is measured against the planned spending defined in PSPC’s 2022 to 2023 Departmental Plan.
The budgetary performance summary table above provides the following:
- Main Estimates and planned spending for 2022 to 2023 as reported in the 2022 to 2023 Departmental Plan
- planned spending for 2023 to 2024 and 2024 to 2025, as reported in the 2023 to 2024 Departmental Plan
- total authorities available for use in 2022 to 2023 which reflects the Main Estimates as well as the other authorities available for the year, including the Supplementary Estimates
- actual spending for 2020 to 2021, 2021 to 2022 and 2022 to 2023 as reported in the Public Accounts of Canada
The variances observed are explained as follows:
-
the net decrease of $189.8 million between the 2022 to 2023 actual spending and the 2022 to 2023 planned spending is mainly due to:
- delays in several capital and fit-up projects as well as increased revenues for accommodation
- the timing of when payments in lieu of taxes are recovered from other government organizations
- partially offset by:
- expenditures to support the stabilization of pay operations, reduce the backlog of pay issues, increase pay service delivery capacity, and develop a digital solution for the modernization of human resources delivery services
- the net increase of $2.9 million in the actual spending from 2020 to 2021 to 2022 to 2023, is primarily related to:
- expenditures to deliver on the department’s property and infrastructure projects
- partially offset by:
- the decrease in expenditures relating to supplies for the health system in response to the COVID‑19 pandemic
- the timing of recovery of payments in lieu of taxes from other government organizations
Human resources
Human resources summary for core responsibilities and internal services (full‑time equivalents)
The following table presents the full-time equivalents (FTEs) allocated to each of PSPC’s core responsibilities and to internal services.
| Core responsibilities and internal services | 2020 to 2021 actual full-time equivalents | 2021 to 2022 actual full-time equivalents | 2022 to 2023 planned full-time equivalents | 2022 to 2023 actual full-time equivalents | 2023 to 2024 planned full-time equivalents | 2024 to 2025 planned full-time equivalents |
|---|---|---|---|---|---|---|
| Purchase of goods and services | 1,910.00 | 2,106.00 | 2,192.68 | 2,294.00 | 2,291.00 | 2,312.00 |
| Payments and accounting | 4,683.53 | 4,584.65 | 4,791.55 | 4,842.11 | 2,438.00 | 2,420.00 |
| Property and infrastructure | 4,226.01 | 4,405.13 | 4,841.19 | 4,532.33 | 4,718.00 | 4,777.00 |
| Government-wide support | 2,579.18 | 2,513.74 | 2,652.93 | 2,539.11 | 2,690.00 | 2,708.00 |
| Procurement Ombudsman | 29.34 | 28.27 | 29.41 | 31.03 | 30 | 30 |
| Subtotaltable 2 note 1 | 13,428.06 | 13,637.79 | 14,507.76 | 14,238.58 | 12,167.00 | 12,246.00 |
| Internal services | 3,195.40 | 3,138.11 | 3,263.34 | 3,048.96 | 3,259.00 | 3,237.00 |
| Totaltable 2 note 1 | 16,623.46 | 16,775.90 | 17,771.10 | 17,287.54 | 15,426.00 | 15,483.00 |
Table 2 Note
|
||||||
The decrease in net planned spending and full‑time equivalents (FTEs) is due to the end of incremental funding for various programs in PSPC. In particular, the majority of the FTE decrease from 2023 to 2024 and 2024 to 2025 is due to the end of incremental funding received to deliver bi-weekly pay, decrease the backlog of pay issues and stabilize pay operations. However, as per the Budget 2023 announcement, the Federal Pay Administration Program’s incremental funding has been renewed for 2023 to 2024 and 2024 to 2025. The planned spending and FTEs will be revised in the next Department Plan to reflect the approved new level of funding.
Expenditures by vote
For information on PSPC’s organizational voted and statutory expenditures, consult the Public Accounts of Canada 2023.
Government of Canada spending and activities
Information on the alignment of PSPC’s spending with the Government of Canada’s spending and activities is available in Government of Canada InfoBase.
Financial statements and financial statements highlights
In this section
Financial statements
Public Services and Procurement Canada’s financial statements (unaudited) for the year ended March 31, 2023, are available on the department’s reports webpage.
Financial statements highlights
| Financial information | 2022 to 2023 planned resultstable 3 note 1 | 2022 to 2023 actual results | 2021 to 2022 actual results (restated) | Difference (2022 to 2023 actual results minus 2022 to 2023 planned results) | Difference (2022 to 2023 actual results minus 2021 to 2022 actual results (restated)) |
|---|---|---|---|---|---|
| Total expenses | 7,091,506,440 | 6,944,125,041 | 7,143,430,143 | (147,381,399) | (199,305,102) |
| Total revenues | 3,468,270,589 | 3,322,733,038 | 3,509,368,000 | (145,537,551) | (186,634,962) |
| Net cost of operations before government funding and transfers | 3,623,235,851 | 3,621,392,003 | 3,634,062,143 | (1,843,848) | (12,670,140) |
Table 3 Note
|
|||||
Expenses
Actual over planned
The 2022 to 2023 expenses were $147 million lower than planned mainly due to fluctuations in business volume with other government departments in Real Property Services Revolving Fund as the scope of projects were reduced, modified or postponed.
Actual year-over-year
The decrease in expenses of $199 million is mainly attributable to a reduction in the purchase of supplies for the health system in response to the COVID‑19 pandemic. This is partially offset by an increase in business volume with other government departments in Real Property Services Revolving Fund.
Revenues
Actual over planned
The 2022 to 2023 revenues were $146 million lower than planned mainly due to fluctuations in business volume with other government departments in Real Property Services Revolving Fund as the scope of projects were reduced, modified or postponed.
Actual year-over-year
The decrease in revenues of $187 million is mainly attributable to a decrease in business volume with other government departments for the purchase of supplies for the health system in response to the COVID‑19 pandemic. This is partially offset by an increase in business volume with other government departments in Real Property Services Revolving Fund.
| Financial information | 2022 to 2023 | 2021 to 2022 (restated) | Difference (2022 to 2023 minus 2021 to 2022 (restated)) |
|---|---|---|---|
| Total net liabilities | 4,068,924,576 | 4,346,956,918 | (278,032,342) |
| Total net financial assets | 1,009,162,013 | 1,228,705,345 | (219,543,332) |
| Departmental net debt | 3,059,762,563 | 3,118,251,573 | (58,489,010) |
| Total non‑financial assets | 10,758,454,542 | 9,940,872,981 | 817,581,561 |
| Departmental net financial position | 7,698,691,979 | 6,822,621,408 | 876,070,571 |
Net liabilities
The decrease in total net liabilities of $278 million is mainly attributable to a decrease in accounts payable and accrued liabilities due to purchase of COVID‑19 supplies in 2021 to 2022 as well as a decrease in lease obligations for tangible capital assets as a result of payments made during the year.
Net financial assets
The decrease in total net financial assets of $220 million is mainly attributable to a decrease in accounts receivable and advances mostly due to lower accounts receivable with other government departments as a result of a decrease in purchase of COVID‑19 supplies.
The decrease was partially offset by an increase in Due from the Consolidated Revenue Fund (CRF), which is mostly the result of the aforementioned decrease in accounts receivable from other government departments and a decrease in accounts payable. The amount due from the CRF represents the net amount of cash that the department is able to withdraw from the CRF in order to discharge its liabilities without generating any additional charges against its authorities in the year of the withdrawal.
Non-financial assets
The increase in total non-financial assets of $818 million (assets with a physical substance that are used to deliver services and have a useful life extending beyond one accounting period, such as real property, equipment or machinery that have been purchased, built or leased) is mainly attributable to an increase in tangible capital assets for the rehabilitation of the Parliamentary Precinct through the Long Term Vision and Plan and the modernization of the district energy system in the NCR through the Energy Services Acquisition Program.
This increase is offset by the amortization of tangible capital assets (physical assets held on a continuing basis).
- Date modified: