
Public Services and Procurement Canada
Analysis of trends in spending and human resources: 2018 to 2019 Departmental Results Report
Document navigation for "Analysis of trends in spending and human resources: 2018 to 2019 Departmental Results Report"
On this page
Actual expenditures
Departmental spending trend
The departmental spending trend graph presents trends in the department's planned and actual spending over time. The data represents actual spending (2016 to 2017 to 2018 to 2019) and planned spending (2019 to 2020 to 2021 to 2022) broken down between statutory and voted expenditures.
Analysis of the variances in actual spending and planned spending is provided in the budgetary performance summary for core responsibilities and internal services section.
Public Services and Procurement Canada's planned and actual spending trend: Fiscal 2016 to 2017 until fiscal 2021 to 2022 (in millions of dollars)
This bar graph illustrates the planned and actual spending trend for Public Services and Procurement Canada for 6 fiscal years, between 2016 to 2017, and 2021 to 2022. Financial figures are presented in millions of dollars along the y-axis (vertical), starting at $0, ending at $4,500 million and increasing by $500 million. These are graphed against fiscal years 2016 to 2017 to 2021 to 2022 on the x-axis (horizontal). There are 2 items identified for each fiscal year: statutory spending and voted spending. In 2016 to 2017, actual spending was $87 million for statutory items and $3,118 million for voted items. The total is $3,205 million. In 2017 to 2018, actual spending was $132 million for statutory items and $3,529 million for voted items. The total is 3,661 million. In 2018 to 2019, actual spending was $119 million for statutory items and $3,760 million for voted items. The total is $3,879 million. In 2019 to 2020, planned spending is $128 million for statutory items and $3,087 million for voted items. The total is $3,215 million. In 2020 to 2021, planned spending is $123 million for statutory items and $2,747 million for voted items. The total is $2,870 million. In 2021 to 2022, planned spending is $129 million for statutory items and $2,700 million for voted items. The total is $2,829 million.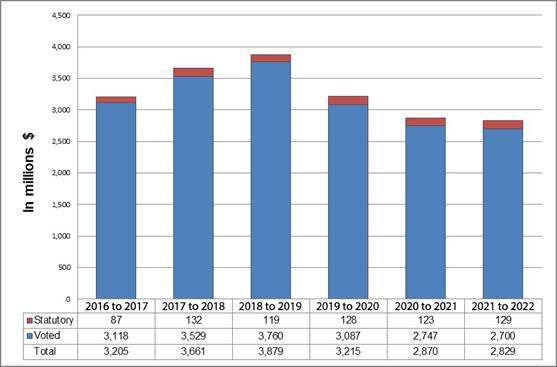
Image description
Budgetary performance summary for core responsibilities and internal services
Totals may not add up due to rounding.
| Core responsibilities and internal services | 2018 to 2019 Main Estimates |
2018 to 2019 planned spending | 2019 to 2020 planned spending |
2020 to 2021 planned spending |
2018 to 2019 Total authorities available for use | 2018 to 2019 actual spending (authorities used) | 2017 to 2018 actual spending (authorities used) | 2016 to 2017 actual spending (authorities used) |
|---|---|---|---|---|---|---|---|---|
| Purchase of goods and services | 117,494,195 | 117,494,195 | 176,577,120 | 160,438,946 | 202,142,459 | 184,354,499 | 175,626,248 | 137,880,348 |
| Payments and accounting | 215,382,307 | 215,382,307 | 248,642,394 | 226,923,727 | 517,637,567 | 469,877,329 | 338,203,919 | 301,215,323 |
| Property and infrastructure | 2,540,948,328 | 2,540,948,328 | 2,425,572,214 | 2,119,542,945 | 2,956,439,600 | 2,829,166,463 | 2,710,895,329 | 2,397,668,818 |
| Government-wide support | 122,059,813 | 122,059,813 | 130,276,919 | 129,446,942 | 137,387,187 | 106,721,614 | 136,782,441 | 102,179,995 |
| Procurement Ombudsman | 4,109,731 | 4,109,731 | 4,122,297 | 4,122,297 | 4,863,016 | 4,398,757 | 3,776,030 | 3,257,831 |
| Subtotal | 2,999,994,374 | 2,999,994,374 | 2,985,190,944 | 2,640,474,857 | 3,818,469,829 | 3,594,518,662 | 3,365,283,967 | 2,942,202,315 |
| Internal services | 235,396,731 | 235,396,731 | 229,893,087 | 229,513,700 | 293,241,231 | 284,557,972 | 295,624,358 | 262,556,577 |
| Total | 3,235,391,105 | 3,235,391,105 | 3,215,084,031 | 2,869,988,557 | 4,111,711,060 | 3,879,076,634 | 3,660,908,325 | 3,204,758,892 |
| Greening of government operationstable 1 note 1 | 0 | 0 | 0 | 0 | 0 | 0 | 0 | 667,815 |
| Grand Total | 3,235,391,105 | 3,235,391,105 | 3,215,084,031 | 2,869,988,557 | 4,111,711,060 | 3,879,076,634 | 3,660,908,325 | 3,205,426,707 |
Table 1 Notes
|
||||||||
As part of the present Departmental Results Report, Public Services and Procurement Canada (PSPC) is informing parliamentarians and Canadians of the budgetary performance achieved for 2018 to 2019. This performance is measured against the planned spending defined in PSPC's 2018 to 2019 Departmental Plan.
The budgetary performance summary table above provides the following:
- Main Estimates and Planned spending for 2018 to 2019, as reported in the 2018 to 2019 Departmental Plan
- planned spending for 2019 to 2020 and 2020 to 2021, as reported in the 2019 to 2020 Departmental Plan
- total authorities to date in 2018 to 2019 which reflects the Main Estimates as well as the other authorities available for the year, including the supplementary estimates and the budget implementation vote
- actual spending for 2016 to 2017, 2017 to 2018 and 2018 to 2019 as reported in the Public Accounts of Canada.
The variances observed are explained as follows:
The difference of $643.7 million between the 2018 to 2019 actual spending and the 2018 to 2019 planned spending is mainly due to:
- additional funding received for Build in Canada Innovation Program to bolster innovation and promote economic growth by supporting Canadian innovators
- funding received through budget 2018 for:
- electronic procurement solution that will modernize the government's procurement function, improve efficiency and help Canadian small and medium-sized businesses better access opportunities to work with the government
- repair, maintenance and operation of federal buildings to maintain current office accommodation and related real property service levels to federal departments and agencies
- stabilization of the Phoenix pay system to continue to stabilize operations, enhance technology, support employees, as well as to increase the pay service delivery capacity and to offer better client service support
The increase of $673.6 million in the actual spending from 2016 to 2017 to 2018 to 2019, is primarily related to:
- additional investments made for repairs and maintenance of federal buildings
- rehabilitation of major public infrastructures, to continue the implementation of the Parliamentary Precinct rehabilitation
- enhanced measures to help stabilize the Phoenix pay system and increase pay service delivery capacity
While PSPC transitioned to the Departmental Results Framework beginning in 2018 to 2019, the expenditures for 2016 to 2017 and 2017 to 2018 that were previously reported based on the program alignment architecture, were restated to comply with the presentation of this Departmental Results Report.
Human resources
Human resources summary for core responsibilities and internal services
| Core responsibilities and internal services | 2016 to 2017 FTEs | 2017 to 2018 actual FTEs | 2018 to 2019 FTEs | 2018 to 2019 actual FTEs | 2019 to 2020 planned FTEs | 2020 to 2021 planned FTEs |
|---|---|---|---|---|---|---|
| Purchase of goods and services | 1,622.89 | 1,560.00 | 1,651.00 | 1,693.80 | 1,724.00 | 1,706.00 |
| Payments and accounting | 2,460.38 | 2,384.42 | 3,886.80 | 3,878.53 | 4,605.59table 2 note 1 | 2,155.59table 2 note 2 |
| Property and infrastructure | 3,443.51 | 3,452.58 | 3,916.00 | 3,999.01 | 4,317.60 | 4,228.73 |
| Government-wide support | 2,145.00 | 2,113.00 | 2,328.80 | 2,292.20 | 2,480.24 | 2,536.24 |
| Procurement Ombudsman | 23.37 | 24.00 | 17.67 | 24.91 | 18.00 | 18.00 |
| Subtotal | 9,695.15 | 9,534.00 | 11,800.27 | 11,888.45 | 13,145.43table 2 note 1 | 10,644.56table 2 note 2 |
| Internal services | 2,700.40 | 2,646.35 | 2,838.60 | 2,740.37 | 2,854.89 | 2,942.89 |
| Total | 12,395.55 | 12,180.35 | 14,638.87 | 14,628.82 | 16,000.32table 2 note 1 | 13,587.45table 2 note 2 |
Table 2 Notes
|
||||||
Expenditures by vote
For information on PSPC's organizational voted and statutory expenditures, consult the Public Accounts of Canada 2018 to 2019.
Government of Canada spending and activities
Information on the alignment of PSPC's spending with the Government of Canada's spending and activities is available in the Government of Canada InfoBase.
Financial statements and financial statements highlights
This section presents the information the department's financial statements.
Financial statements
Public Services and Procurement Canada's Financial Statements (unaudited) for the year ended March 31, 2019, are available on the Consolidated Departmental Financial Statements for year ended March 31, 2019 (unaudited) website.
Financial statements highlights
| Financial information | 2018 to 2019 planned results |
2018 to 2019 actual results |
2017 to 2018 actual results (restated) |
Difference (2018 to 2019 actual results minus 2018 to 2019 planned results) |
Difference (2018 to 2019 actual results minus 2017 to 2018 actual results [restated]) |
|---|---|---|---|---|---|
| Total expenses | 5,532,688,494 | 6,255,713,131 | 6,024,341,094 | 723,024,637 | 231,372,037 |
| Total revenues | 2,976,220,801 | 3,045,847,219 | 3,027,807,677 | 69,626,418 | 18,039,542 |
| Net cost of operations before government funding and transfers | 2,556,467,693 | 3,209,865,912 | 2,996,533,417 | 653,398,219 | 213,332,495 |
Expenses
Actual over planned
The 2018 to 2019 expenses were $723 million higher than planned (planned: $5,532.7 million; actual: $6,255.7 million). The increase is mainly attributable to the property and infrastructure and payments and accounting core responsibilities due to:
- additional funding received for the repair, maintenance and operation of federal buildings as well as for the operational and maintenance support to the Parliamentary Precinct buildings
- additional funding received to help stabilize the Phoenix pay system and increase pay service delivery capacity
Actual year over year
The increase in expenses of $231 million (2018 to 2019: $6,255.7 million; 2017 to 2018: $6,024.3 million) is mainly attributable to the property and infrastructure and payments and accounting core responsibilities due to:
- increased business volume related to construction and repair work performed as part of the government's commitment to build and renew infrastructure across Canada for other government departments
- an increase in repair and maintenance of federal buildings to provide a safe, healthy and secure workplace
- an increase related to additional funding received to help stabilize the Phoenix pay system and increase pay service delivery capacity
Revenues
Actual over planned
The 2018 to 2019 revenues were $70 million higher than planned (planned: $2,976.2 million; actual: $3,045.8 million), and this is due to higher than anticipated business volume for accommodation services.
Actual year over year
The increase in revenues of $18 million (2018 to 2019: $3,045.8 million; 2017 to 2018: $3,027.8 million) is mainly attributable to an increase in business volume related to vaccine procurement service and translation services.
| Financial Information | 2018 to 2019 | 2017 to 2018 (restated) |
Difference (2018 to 2019 minus 2017 to 2018 [restated]) |
|---|---|---|---|
| Total net liabilities | 3,710,738,914 | 3,843,086,143 | (132,347,229) |
| Total net financial assets | 1,342,506,314 | 1,264,807,911 | 77,698,403 |
| Departmental net debt | 2,368,232,600 | 2,578,278,232 | (210,045,632) |
| Total non-financial assets | 7,934,369,647 | 7,360,509,434 | 573,860,213 |
| Departmental net financial position | 5,566,137,047 | 4,782,231,202 | 783,905,845 |
Net liabilities
The decrease in total net liabilities of $132 million is mainly attributable to a decrease in lease obligations for tangible capital assets as a result of payments made during the year.
Net financial assets
The increase in total net financial assets of $78 million is mainly attributable to an increase in accounts receivable and advances mostly due to the sale of real property.
Non-financial assets
The increase in total non-financial assets of $574 million (assets with a physical substance that are used to deliver services and have a useful life extending beyond an accounting period), such as real property, equipment or machinery that have been purchased, built or leased. The increase is mainly attributable to an increase in buildings mainly related to the rehabilitation of the West Block, the Senate of Canada Building (formerly known as Government Conference Centre) and the Centre Block, as well as the construction of the Visitor Welcome Centre, as part of Parliamentary Precinct's Long Term Vision and Plan Project.
This increase is offset by the amortization of tangible capital assets (physical assets held on a continuing basis).
Document navigation for "Analysis of trends in spending and human resources: 2018 to 2019 Departmental Results Report"
- Date modified: