
Public Services and Procurement Canada
Spending and human resources: 2020 to 2021 Departmental Plan
Document navigation for "2020 to 2021 Departmental Plan"
On this page
This section provides an overview of the department's planned spending and human resources for the next 3 consecutive fiscal years, and compares planned spending for the upcoming year with the current and previous years' actual spending.
Planned spending
The departmental spending trend graph presents trends in the department's planned and actual spending over time. The data representing actual spending (2017 to 2018 to 2018 to 2019), forecast spending (2019 to 2020) and planned spending (2020 to 2021 to 2022 to 2023), is broken down between statutory and voted expenditures.
Analysis of the variances in actual spending, forecast spending and planned spending is provided in the budgetary planning summary for core responsibilities and internal services section.
Departmental spending 2017 to 2018 to 2022 to 2023
The following graph presents planned (voted and statutory) spending over time.
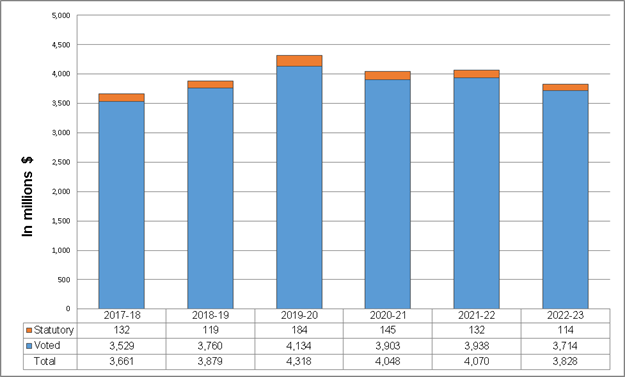
Text version
This bar graph illustrates the spending trend for Public Services and Procurement Canada for fiscal years 2017 to 2018, 2018 to 2019, 2019 to 2020, 2020 to 2021, 2021 to 2022 and 2022 to 2023. Financial figures are presented in dollars along the y-axis (vertical), starting at $0, ending at $5 billion and increasing by $500 million. These are graphed against fiscal years 2017 to 2018 to 2022 to 2023 on the x-axis (horizontal).
There are 2 items identified for each fiscal year: statutory spending and voted spending.
In 2017 to 2018, actual spending was $132 million for statutory items and $3,529 million for voted items. The total was $3,661 million.
In 2018 to 2019, actual spending was $119 million for statutory items and $3,760 million for voted items. The total was $3,879 million.
In 2019 to 2020, actual spending was $184 million for statutory items and $4,134 million for voted items. The total was $4,318 million.
In 2020 to 2021, forecast spending is $145 million for statutory items and $3,903 million for voted items. The total is $4,048 million.
In 2021 to 2022, planned spending is $132 million for statutory items and $3,938 million for voted items. The total is $4,070 million.
In 2022 to 2023, planned spending is $114 million for statutory items and $3,714 million for voted items. The total is $3,828 million.
Budgetary planning summary for core responsibilities and internal services (dollars)
The following table shows actual, forecast and planned spending for each of Public Services and Procurement Canada's (PSPC) core responsibilities and to internal services for the years relevant to the current planning year.
| Core responsibilities and internal services | 2017 to 2018 expenditures |
2018 to 2019 expenditures |
2019 to 2020 forecast spending |
2020 to 2021 budgetary spending (as indicated in Main Estimates) | 2020 to 2021 planned spending |
2021 to 2022 planned spending |
2022 to 2023 planned spending |
|---|---|---|---|---|---|---|---|
| Purchase of goods and services | 175,626,248 | 184,354,499 | 174,202,037 | 206,899,418 | 206,899,418 | 147,864,928 | 144,920,400 |
| Payments and accounting | 338,203,919 | 469,877,329 | 615,780,232 | 316,291,929 | 316,291,929 | 311,205,052 | 219,116,779 |
| Property and infrastructure | 2,710,895,329 | 2,829,166,463 | 3,026,624,168 | 3,068,409,083 | 3,068,409,083 | 3,183,871,405 | 3,060,777,747 |
| Government-wide support | 136,782,441 | 106,721,614 | 169,028,879 | 170,809,108 | 170,809,108 | 152,004,622 | 140,346,346 |
| Procurement Ombudsman | 3,776,030 | 4,398,757 | 4,418,726 | 4,138,544 | 4,138,544 | 4,149,751 | 4,152,605 |
| Subtotal | 3,365,283,967 | 3,594,518,662 | 3,990,054,042 | 3,766,548,082 | 3,766,548,082 | 3,799,095,758 | 3,569,313,877 |
| Internal services | 295,624,358 | 284,557,972 | 327,476,510 | 281,723,937 | 281,723,937 | 271,071,532 | 258,397,860 |
| Total | 3,660,908,325 | 3,879,076,634 | 4,317,530,552 | 4,048,272,019 | 4,048,272,019 | 4,070,167,290 | 3,827,711,737 |
Totals may not add up due to rounding.
The variances observed are explained as follows:
- for 2019 to 2020, the department plans to spend approximately $657 million more than in 2017 to 2018; the increase is due to a broad suite of initiatives including:
- additional funding to stabilize the pay system and operations
- rehabilitation of major public infrastructure, to reduce risks related to health and safety and to ensure long term stewardship of these assets
- increased funding for the protection against inflation and price variations relating to rent and utilities
- for 2020 to 2021, the planned spending is approximately $269 million less than the 2019 to 2020 forecasted spending; the decrease is due primarily to the following:
- the end of incremental funding received from Budget 2019 for:
- improvements towards stabilization of the pay delivery, including systems and processes
- the Federal Accommodation Program to provide office accommodation and related real property services to federal departments and agencies
- the end of incremental funding received from Budget 2019 for:
- offset by an increase in funding received in 2020 to 2021 to establish a long-term capital funding management strategy to manage the department's portfolio of assets
- for 2022 to 2023, the department plans to spend $221 million less than in 2020 to 2021; the decrease is due to the end or winding down of funding in a broad suite of initiatives including:
- the end of incremental funding received from Budget 2019 to stabilize the pay operations
- reduction in funding requirements following the implementation of electronic procurement solution, an initiative from Budget 2018 that will result in simpler and better procurement
- the completion of information technology projects in 2020 to 2021 and 2022 to 2023
While PSPC transitioned to the Departmental Results Framework beginning in 2018 to 2019, the expenditures for 2017 to 2018 that were previously reported based on the program alignment architecture, were restated to comply with the presentation of this Departmental Plan.
2020 to 2021 Budgetary planned gross spending summary (in dollars)
| Core responsibilities and Internal Services | 2020 to 2021 planned gross spending |
2020 to 2021 planned revenues netted against expenditures |
2020 to 2021 planned net spending |
|---|---|---|---|
| Purchase of goods and services | 486,719,824 | 279,820,406 | 206,899,418 |
| Payments and accounting | 455,594,880 | 139,302,951 | 316,291,929 |
| Property and infrastructure | 6,005,529,040 | 2,937,119,957 | 3,068,409,083 |
| Government-wide support | 467,632,948 | 296,823,840 | 170,809,108 |
| Procurement ombudsman | 4,138,544 | 0 | 4,138,544 |
| Subtotal | 7,419,615,236 | 3,653,067,154 | 3,766,548,082 |
| Internal services | 352,533,659 | 70,809,722 | 281,723,937 |
| Total | 7,772,148,895 | 3,723,876,876 | 4,048,272,019 |
PSPC's major sources of revenues netted against expenditures are collected through the Real Property Federal Accommodation and Infrastructure program as well as through its three active Revolving Funds.
The Real Property Services Revolving Fund collects most revenues by providing real property services such as project delivery, facility management and advisory services. The Real Property Federal Accommodation and Infrastructure program generates revenues mainly through the provision of spaces, conference rooms and parking, the preparation of spaces for occupancy and the production and distribution of utilities.
Revenues are also collected through the Optional Services Revolving Fund which provides communications, travel and vaccines procurement services, as well as through the Translation Bureau Revolving Fund which provides translation, interpretation and other linguistic services.
Planned human resources
The following table shows actual, forecast and planned full-time equivalents for each core responsibility in PSPC's departmental results framework and to internal services for the years relevant to the current planning year.
Human resources planning summary for core responsibilities and Internal Services
| Core responsibilities and internal services | 2017 to 2018 actual full-time equivalents |
2018 to 2019 actual full-time equivalents |
2019 to 2020 forecast full-time equivalents |
2020 to 2021 planned full-time equivalents |
2021 to 2022 planned full-time equivalents |
2022 to 2023 planned full-time equivalents |
|---|---|---|---|---|---|---|
| Purchase of goods and services | 1,560.00 | 1,693.80 | 1,724.00 | 1,860.30 | 1,800.60 | 1,772.40 |
| Payments and accounting | 2,384.42 | 3,878.53 | 4,605.59 | 2,399.05 | 2,408.79 | 2,422.79 |
| Property and infrastructure | 3,452.58 | 3,999.01 | 4,317.60 | 4,423.02 | 4,365.26 | 4,329.91 |
| Government-wide support | 2,113.00 | 2,292.20 | 2,480.24 | 2,511.54 | 2,509.04 | 2,506.46 |
| Procurement Ombudsman | 24.00 | 24.91 | 18.00 | 20.89 | 20.01 | 20.01 |
| Subtotal | 9,534.00 | 11,888.45 | 13,145.43 | 11,214.90 | 11,103.70 | 11,051.57 |
| Internal services | 2,646.35 | 2,740.37 | 2,854.89 | 3,018.52 | 3,030.18 | 3,041.78 |
| Total | 12,180.35 | 14,628.82 | 16,000.32 | 14,233.42 | 14,133.88 | 14,093.35 |
Estimates by vote
Information on Public Services and Procurement Canada's organizational appropriations is available in the 2020 to 2021 Main Estimates .
Condensed future-oriented statement of operations
The condensed future-oriented statement of operations provides an overview of PSPC's operations for 2019 to 2020 to 2020 to 2021.
The amounts for forecast and planned results in this statement of operations were prepared on an accrual basis. The amounts for forecast and planned spending presented in other sections of the Departmental Plan were prepared on an expenditure basis. Amounts may therefore differ.
A more detailed future-oriented statement of operations and associated notes, including a reconciliation of the net cost of operations to the requested authorities, are available on Public Services and Procurement Canada's website.
Condensed future-oriented statement of operations for the year ending March 31, 2021 (dollars)
| Financial information | 2019 to 2020 forecast results | 2020 to 2021 planned results | Difference (2020 to 2021 planned results minus 2019 to 2020 forecast results) |
|---|---|---|---|
| Total expenses | 7,062,079,011 | 6,480,526,501 | (581,552,510) |
| Total revenues | 3,308,234,513 | 3,225,377,747 | (82,856,766) |
| Net cost of operations before government funding and transfers | 3,753,844,498 | 3,255,148,754 | (498,695,744) |
The net cost of operations is forecasted to decrease by $498.7 million in 2020 to 2021 from $3,753.8 to $3,255.1 million. This decrease is primarily attributable to the end of incremental funding received from Budget 2018 for:
- improvements towards stabilization of the pay delivery, including systems and processes
- the Federal Accommodation Program to provide office accommodation and related real property services to federal departments and agencies
Document navigation for "2020 to 2021 Departmental Plan"
- Date modified: